| NETWORK
REPORT |
||||||||||||||||||||||||||||||||||||||||||||||||||||||||||||||||||||||||||||||||||||||||||||||||||||
Introduction This document provides a report on the general health of your Local Area Network (LAN). Network overload can occur when bandwidth utilisation exceeds a safe operational condition due, for example, to its topology, applications or user profiles. Recognising overload on a specific network requires an understanding of the normal operational conditions on that network. This report records and measures a segment’s state of operation over a specified period of time. Every network has a standard mode of operation that needs to be considered as its baseline or normal level of operation. A key to network optimization is to always analyze a network in relation to a previous benchmark or baseline. A CHEVIN NETWORK ANALYSER (CNA) LAN Analyzer, directly connected to a segment does not create any additional traffic, nor does it use any network bandwidth that may affect network performance. Data from remote segments (gathered using Chevin’s Pod software) is transmitted across the network to the CNA management station. However due to the extremely high efficiency of the protocol employed, this loading is very low, typically less than 50 packets, and therefore does not constitute any significant additional network loading. Where you undertake remedial action through any major logical or physical network change, a critical final step is to re-test the network to get a benchmark of the network’s performance level. Where this report indicates specific problems on the network (LAN), further investigation may be needed in order to isolate the exact cause of the problem. Problems on a network can consist of defective cables, defective transceivers, defective network interface cards (NIC), corrupted network interface software drivers, mismatched versions of network interface software drivers, or network software configuration. It unwise and counterproductive to overload an Ethernet network, due to the nature of the contention system used by Ethernet, CSMA/CD (Carrier Sense, Multiple Access with Collision Detection). CSMA/CD determines that each node with a packet of data to send must listen to the cable to see if it is busy. If the cable is busy the node waits. When the cable goes quiet, the node immediately sends its packet. On a lightly loaded network, CSMA/CD works virtually every time, however, Ethernet is a ‘democratic’ system and there is no order of precedence. All nodes have an equal chance of getting their data onto the cable (Multiple Access). However, as the number of nodes attached to the network increases, so does the loading and therefore the chances of a ‘collision’. A collision occurs where two devices attempt to send packets at the same time which is unacceptable to Ethernet which provides an "all or nothing" service. Since all devices continue to listen while they transmit (Carrier Sense) collisions are detected by both devices which then stop transmitting immediately and back off for a random amount of time before attempting to transmit again (Collision Detection). As loading increases above approximately 30% the amount of collisions and consequent retries increases dramatically, severely reducing the throughput of the network.
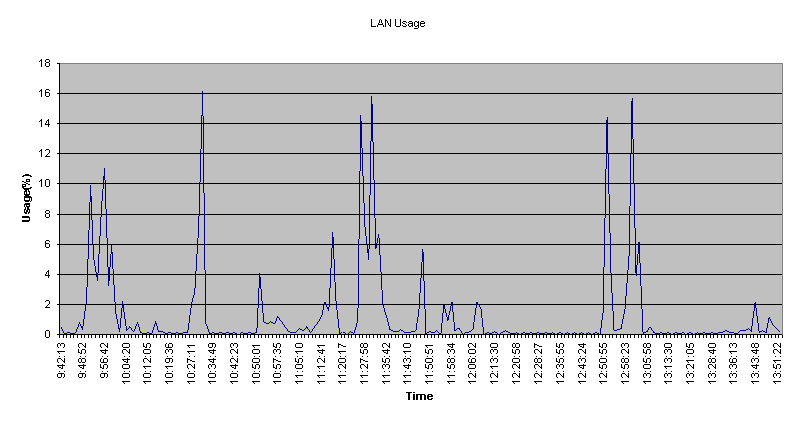
Network bandwidth utilization is represented in the following graph. Bandwidth utilization is the percentage of available bandwidth the network is using at any given time. Average utilization is the amount of utilization on a network over a specified standard period of time. Peak utilization is the highest peak of utilization reached during a specified time. Over utilising network bandwidth can be the major factor in network performance assessment. Certain industry standards exist for most local area network environments. For an Ethernet network to be considered running optimally, the average bandwidth usage level should not exceed 30 percent, and the peak usage should be between 50-60 percent. When an Ethernet utilisation reaches 40-50 percent on average with peak usage of 60-70 percent, bandwidth would become a concern, and segmentation using Ethernet switches or bridges should be considered. Careful planning of network expansion becomes important at this point, though network performance is likely to be acceptable for most Users. Serious performance degradation begins at 60 percent average usage with peak usage between 80-90 percent. At this point, Ethernet switching, bridging or routing to segment/filter traffic should be considered.
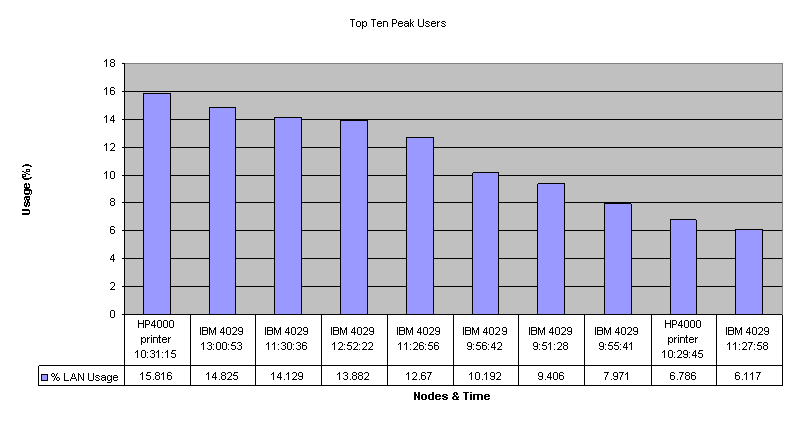
Top Ten Peaks
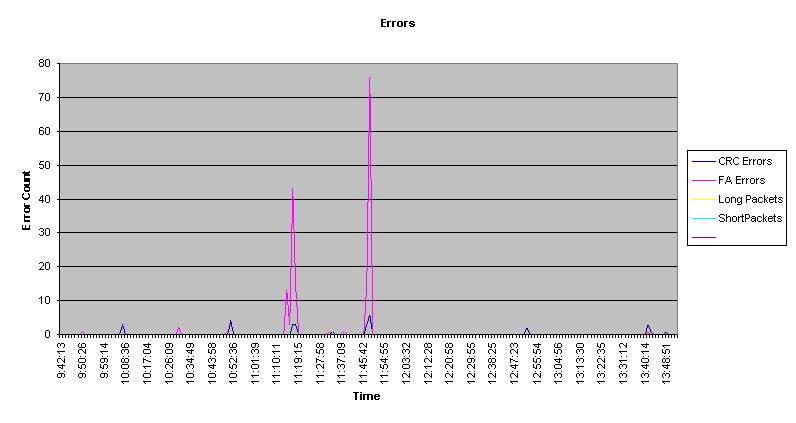
Errors Cyclic Redundancy Check (CRC) and Frame Alignment (FA) errors indicate a byte-alignment problem in the transmitted or received packet. Runt packets are smaller than the legal size according to Ethernet standards (64 bytes).
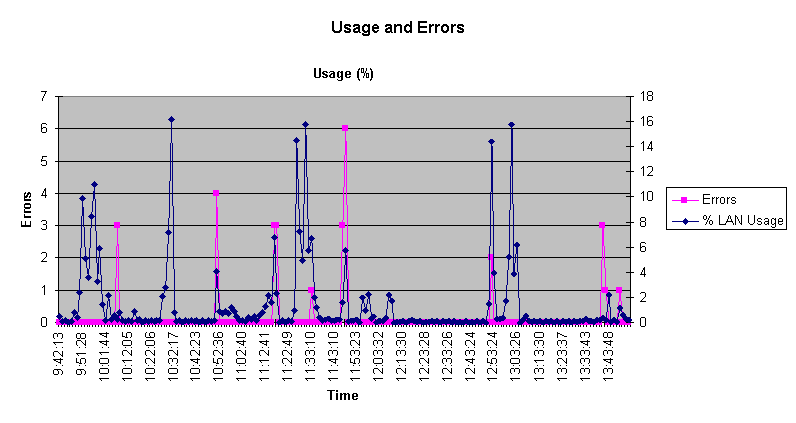
Usage and Errors
Top Ten Nodes This section defines the Top 10 Talkers or busiest nodes on the network during the collection period. Nodes are represented by their unique physical Media Access Control (MAC) level address, or the name that has been assigned to them during on-site data collection. This data can be used to support logical and physical workgroup configuration on the network.
Top Ten Conversations
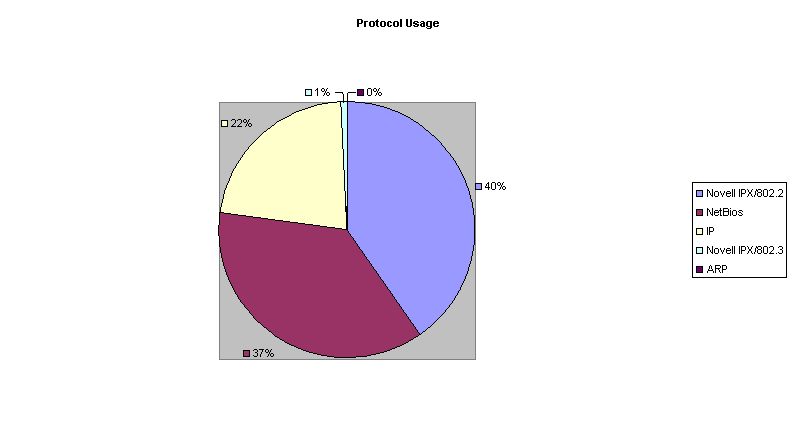
Protocol Usage Most networks support more than one protocol and this section of the report breaks down, by percentage, the actual amount bandwidth utilization of the specific protocols on the network. This measurement is important from an optimisation standpoint because, as networks change over a period of time, it is important to keep track of the protocol activity, especially when you add new applications or network hardware.
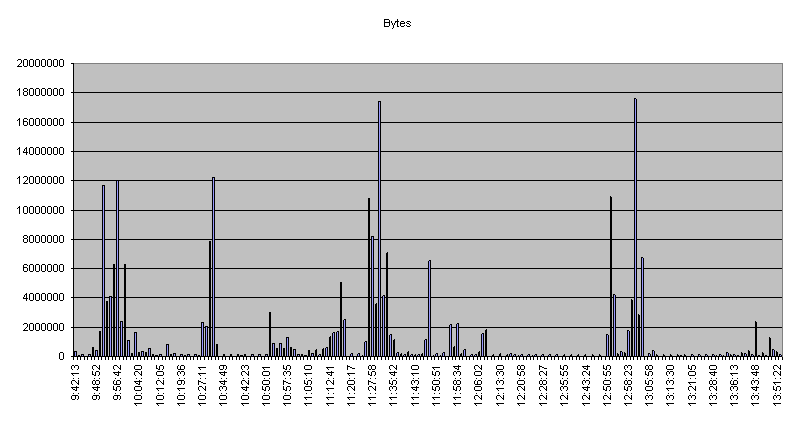
Octets
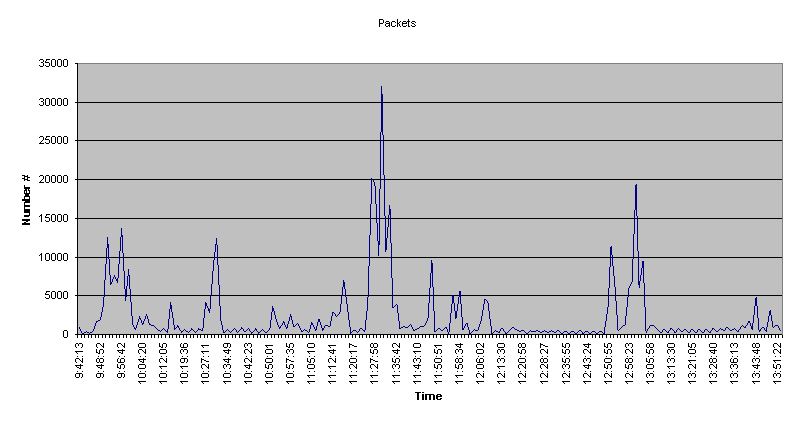
Packets The graph below shows the number of Packets Transmitted during each of the sample periods.
Packet Throughput
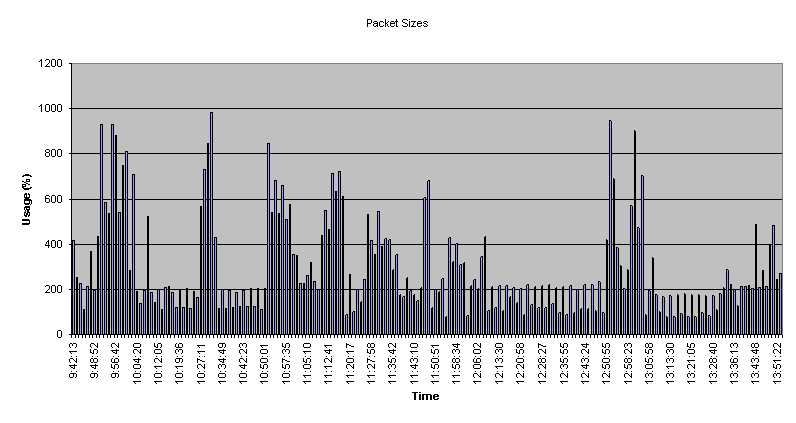
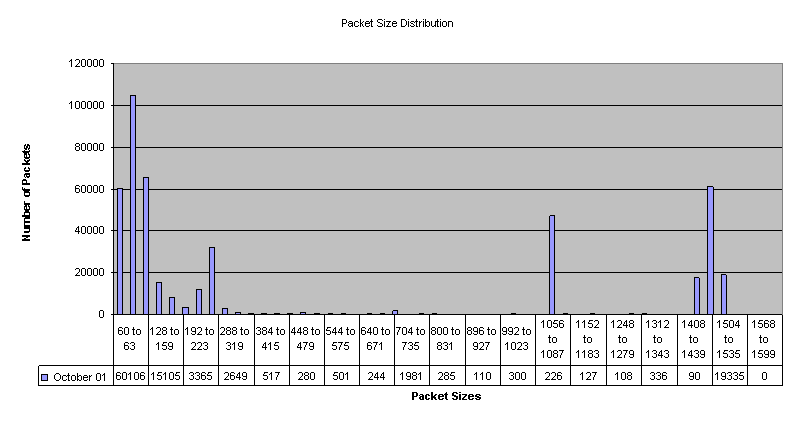
More throughput can be achieved by sending data in larger packets. However, you need to remember that not all protocols can be configured to send data larger packets.
Mean Packet Sizes
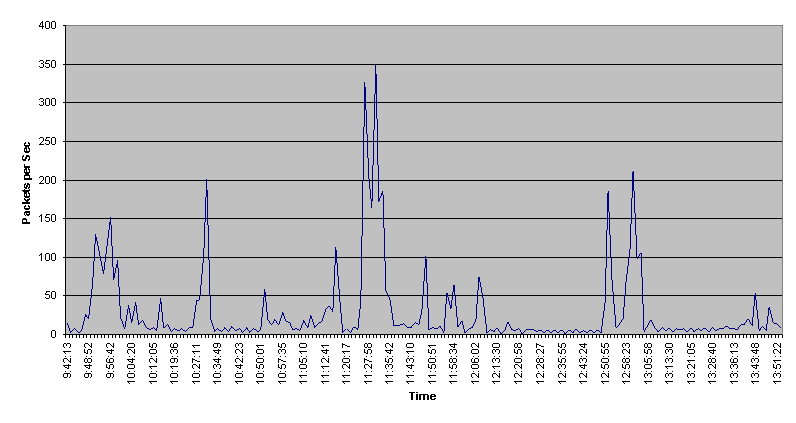
Packets Per Second
Packet Size Distribution
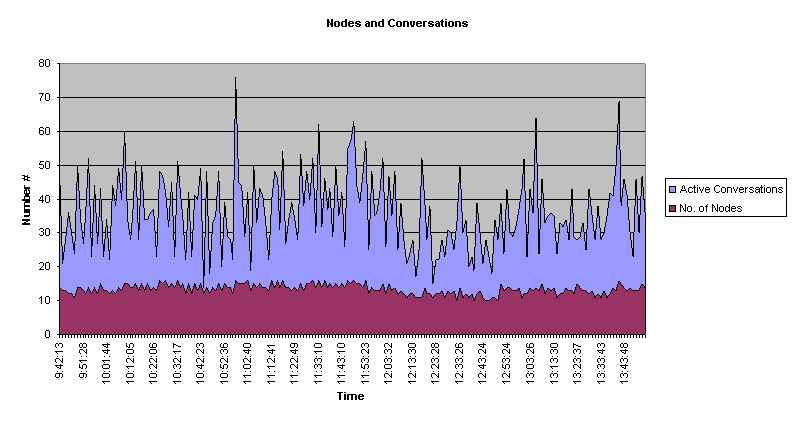
Nodes/Conversations This section shows the total number of nodes recognized on the network and the nature of the relationshjps that exist between them, which, for the purpose of this report are defined as "conversations". There is no high or low threshold for the number of nodes, but the information can be important when considering physical network configuration issues.
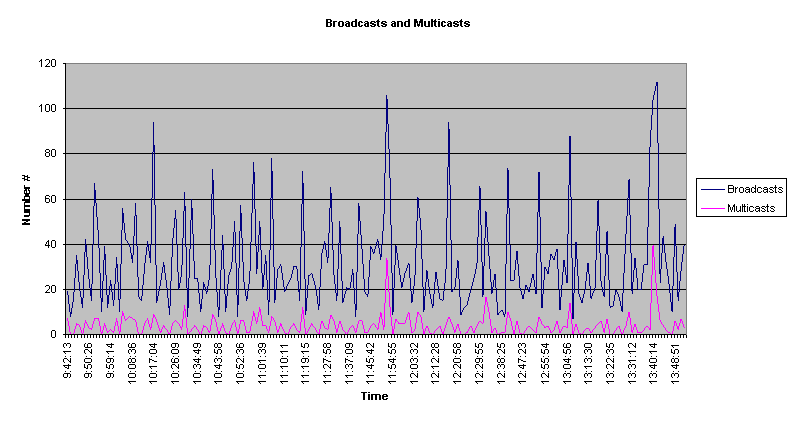
Broadcast/Multicast Packets Nodes on the network use broadcast packets to verify certain means of communication, advertise available services and relay routing information about remote networks which are accessible. Certain levels of broadcasts are normal and defining an actual number or percentage that is acceptable is difficult because each network has a different broadcast dependency.
A Broadcast packet is received and understood by all nodes connected to a LAN. Multicast packets are vendor or application specific, and will only be recognised by devices and applications that are specifically configured to receive them. |
||||||||||||||||||||||||||||||||||||||||||||||||||||||||||||||||||||||||||||||||||||||||||||||||||||
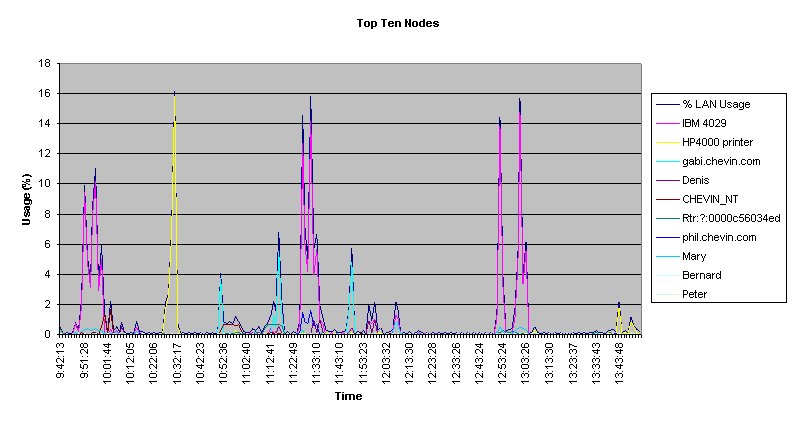 It is important that you track
nodes creating the most traffic on the network. Though
this type of information is dynamic and may change
frequently, it is a key workload characteristic of any
specific network. File servers and terminal servers would
normally constitute the busiest nodes. User nodes
featured in these graphs are likely to be considered
Power Users on your network.